NASにTS-109を使っていた頃、Raspberry Piに取り付けた温度・気圧センサーの値をNAS上のMRTGで集計してグラフ表示するということをやっていました。NASを交換したのを機会に、Raspberry Piの上でMuninを動かして、温度・気圧センサーの値をグラフ表示するようにしてみました。
MuninはMRTGと同じようないわゆるサーバー監視ツールです。MRTGと比べるとずっと簡単にインストールできて、扱いも簡単なようです。
まずは、Munin をRaspberry Piにインストールするところからです。方法はネットで探すといくらでも出てきますが、ポイントはApacheを先にインストールすること、のようです。以下のサイトを参考にしました。
http://kinokotimes.com/2016/07/17/raspberry_pi_and_munin/
https://lespo.net/rasppi2-munin.html
私もよく知らないまま、先にMuninをインストールして、一旦、削除する羽目になりました。
なんだかんだで、Muninが動いて、PCのブラウザから表示できるようになりました。
次は、温度・気圧センサーの値の表示です。こちらのサイトを参考にしました。
https://lespo.net/munin-glaf.html
温度の値を取るために、以下のスクリプトを動かしています。気圧の値を取るためのスクリプトもほぼ同じです。
pi@raspberrypi:/usr/share/munin/plugins$ cat temperature
#!/bin/sh
#%# family=auto
#%# capabilities=autoconf
GETNUM=`python /usr/local/bin/bmp180-munin.py 11 4`
if [ “$1” = “autoconf” ]; then
if [ -n ${GETNUM} ] ; then
echo yes
exit 0
else
echo no
exit 0
fi
fi
if [ “$1” = “config” ]; then
echo ‘graph_title temperature’
echo ‘graph_args -r –lower-limit 0’
echo ‘graph_vlabel C’
echo ‘graph_category Weather’
echo ‘total.label temperature’
echo ‘total.min 0’
echo ‘total.draw LINE2’
echo ‘total.type GAUGE’
exit 0
fi
echo “total.value $GETNUM”;
気圧センサーの値の方はこんな感じです。グラフの下の線が940hPaになるように調整しています。
pi@raspberrypi:/usr/share/munin/plugins$ cat pressure
#!/bin/sh
#%# family=auto
#%# capabilities=autoconf
GETNUM=`python /usr/local/bin/bmp180-munin-pres.py 11 4`
if [ “$1” = “autoconf” ]; then
if [ -n ${GETNUM} ] ; then
echo yes
exit 0
else
echo no
exit 0
fi
fi
if [ “$1” = “config” ]; then
echo ‘graph_title pressure’
echo ‘graph_args -r -l 940 –lower-limit 940’
echo ‘graph_scale no’
echo ‘graph_vlabel hpa’
echo ‘graph_category Weather’
echo ‘total.label pressure’
echo ‘total.min 0’
echo ‘total.draw LINE2’
echo ‘total.type GAUGE’
exit 0
fi
echo "total.value $GETNUM";
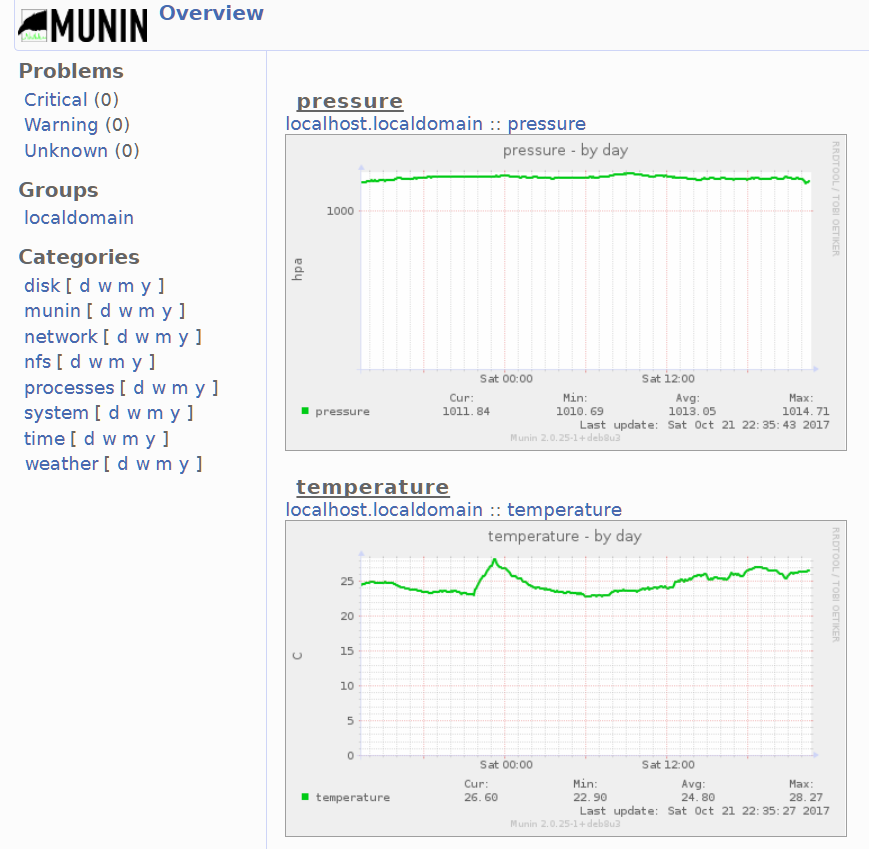
こんな具合に表示できました。ちゃんとした温度計で見ると今の室温は21.2°Cなので、センサーの値はちょっと高めに出ているようです。